Credit union members subsidize the cost of operations; it’s their investment in the cooperative. How do members know if they are getting a good return on that investment? To answer that question, a peer group of credit unions with similar levels of operating expense is created. Seven aspects of performance that can be precisely quantified are then used to evaluate return on member investment.
Member Value is created when the credit union is more productive than peer (more output for the same investment in operating expense). Value is created when the credit union: (click links to see how)
The most productive credit unions have a competitive advantage -- they are able to price loans and shares more attractively to capture market share. Value is also created when the credit union: (click on links to see how)
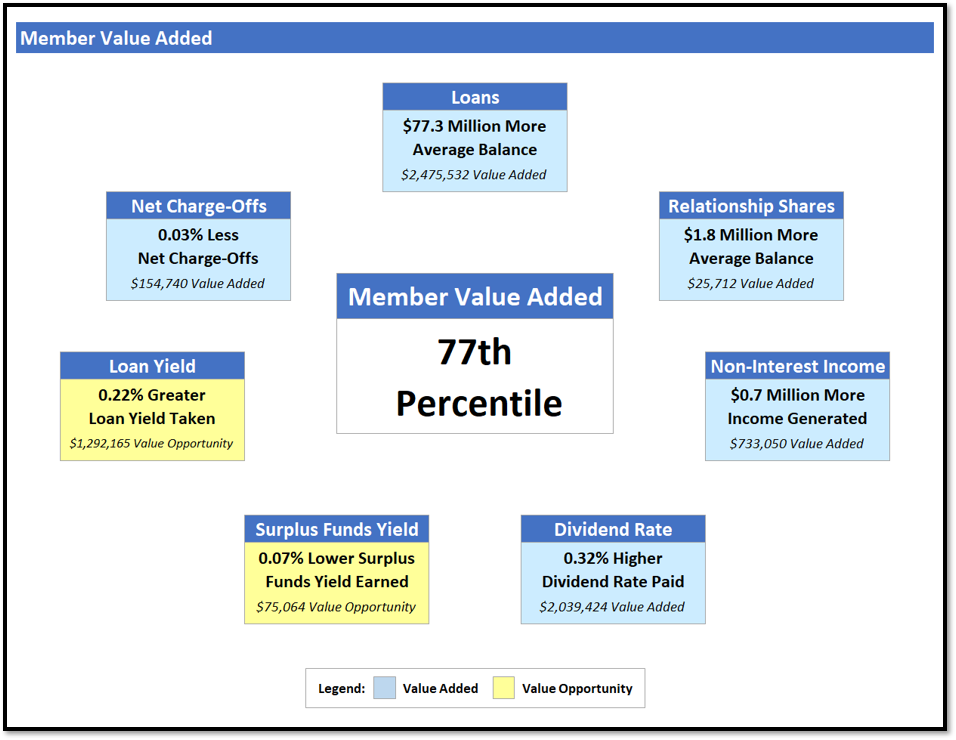
Summary of Member Value Added. A summary that displays each Member Value Added measure, how performance compares to peer, and what the difference means in terms of financial impact. For example, if a credit union holds more loan balance than peer, the impact upon net income is the difference in balance multiplied by the spread between the loan yield and surplus funds yield (the true economic benefit derived from holding more balance for the same "spend" on operations).
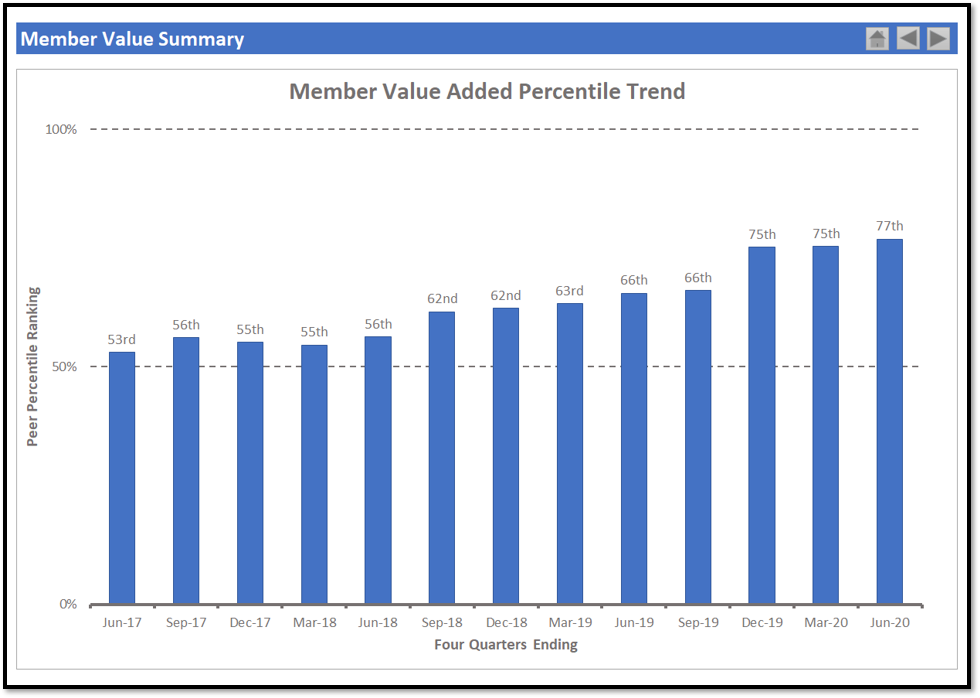
Member Value Added Trend. A three-year trend of overall Member Value Added. In the example below, you can see the credit union has made steady improvement over time.
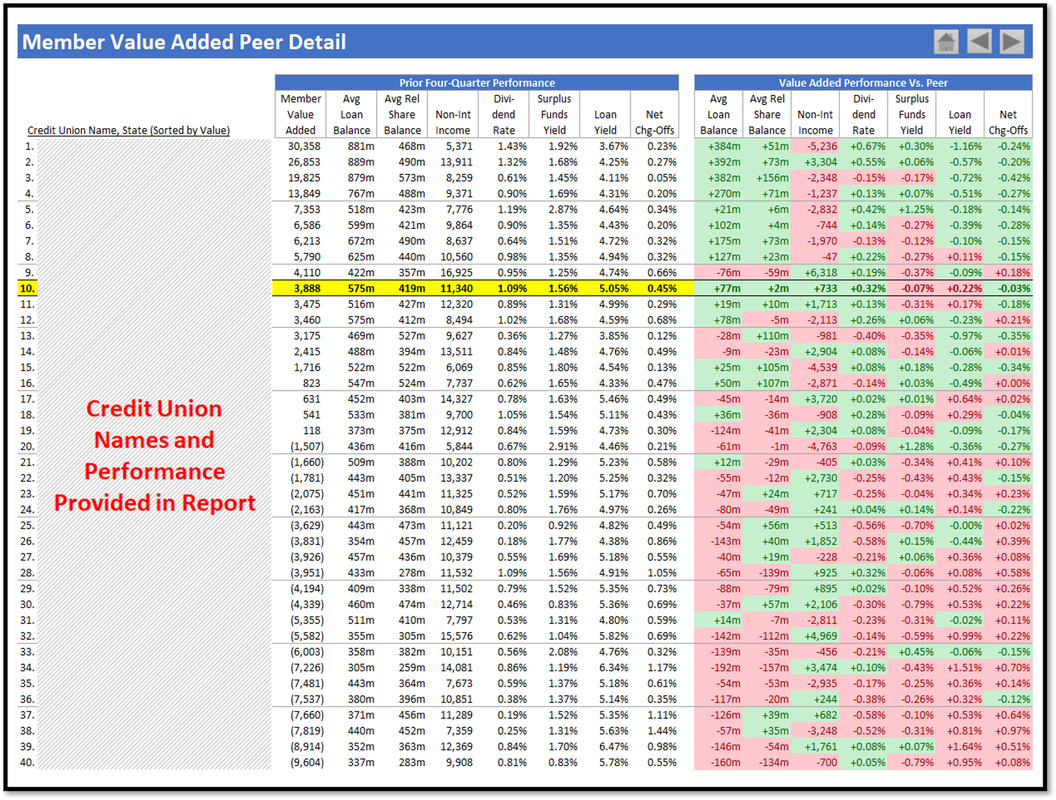
Member Value Added Detail. The report includes a summary that details each aspect of Member Value Added in the peer group. You can use this information to understand the characteristics of top value creators.